Want to boost your marketing campaigns? These 7 AI tools can help you track performance, analyze data, and make smarter decisions in real-time. Here’s a quick overview of what each tool offers:
- Metabase: User-friendly dashboards with real-time analytics, automated reporting, and cross-platform integration. Great for small to medium businesses.
- Power BI: Centralized data, real-time insights, and advanced visualizations. Ideal for enterprises and Microsoft users.
- Tableau: Advanced data visualization, real-time tracking, and seamless integrations. Perfect for large-scale analytics.
- Google BigQuery: Handles massive datasets with speed, real-time queries, and machine learning features. Best for technical teams and enterprise-level data.
- Looker Studio: Free, easy-to-use dashboards with live updates and integration with Google tools. Great for small businesses and quick reporting.
- Mode: Advanced analytics with Python/R integration and customizable dashboards. Suitable for collaborative teams.
- Rows: Spreadsheet-based tool with AI features, real-time updates, and extensive integrations. Perfect for marketers familiar with spreadsheets.
Quick Comparison
| Tool | AI Features | Integrations | Pricing | Best For |
|---|---|---|---|---|
| Metabase | Predictive analytics | 20+ platforms | Free/$85+ per month | SMBs, self-service analytics |
| Power BI | Machine learning, Q&A | 100+ sources | $10-$20 per user | Enterprises, Microsoft users |
| Tableau | Automated forecasting | 70+ connectors | $42-$70 per user | Large-scale visualization |
| BigQuery | Built-in ML models | Google ecosystem | Pay-as-you-go | Enterprise, technical teams |
| Looker Studio | Smart suggestions | 800+ connectors | Free | SMBs, Google-centric users |
| Mode | Anomaly detection | 40+ platforms | Free/$35+ per user | Collaborative analytics |
| Rows | AI-powered spreadsheets | 40+ platforms | Free/$59+ per month | Spreadsheet users, small teams |
These tools simplify campaign tracking, automate reporting, and deliver actionable insights. Whether you’re a small business or a large enterprise, there’s an option here to fit your needs. Dive into the article for detailed features and use cases.
5 AI Tools Every CMO Should Know | Marketing Analytics & Strategy Insights
What to Look for in AI Campaign Tracking Tools
Picking the right AI campaign tracking tool is a game-changer. With 72% of businesses now integrating AI into their operations, the pressure to make the right choice is intense. The best tools don’t just collect data - they help turn it into actionable insights that can elevate your campaigns.
Real-time tracking is a must-have. For example, U.S. Bank leveraged Salesforce's Einstein for predictive lead scoring and saw a 25% boost in closed deals along with a 300% jump in marketing qualified leads. These real-time insights allowed their team to act quickly and effectively.
"Your job will not be taken by AI. It will be taken by a person who knows how to use AI."
– Christina Inge
Another key feature is cross-platform integration, which brings all your data under one roof. Look for tools that connect seamlessly with platforms like Google Ads, Meta, and LinkedIn. This integration simplifies reporting and saves time. One agency owner shared their experience:
"As a digital marketing agency, we were struggling to analyze and optimize ads for many brands on both Google and Facebook, which hampered our reporting efforts. Thanks to WASK, being able to analyze and optimize all of our clients' ads from a single platform saved us both cost and time."
– Atakan T., Inolyzer Digital Marketing Agency
Automation is another game-changer. Automated reporting eliminates the need for manual spreadsheets, freeing up your team’s time for strategic tasks. With 90% of marketing professionals using AI to automate customer interactions, manual processes are quickly becoming a thing of the past. The best tools deliver consistent, error-free reports exactly when you need them.
Predictive analytics can be a decisive factor in campaign success. Take North Face, for example. By using Google Analytics 360, they uncovered that customers were searching for "midi parka", a term they hadn’t considered. Renaming a product accordingly led to a threefold increase in conversions and revenue.
When it comes to metrics, focus on tools that track the essentials - click-through rates (CTR), cost per click (CPC), return on ad spend (ROAS), and conversion rates. These KPIs provide a clear picture of engagement and campaign performance without overwhelming your dashboard.
The best tools also offer AI-driven recommendations, helping you make smarter decisions. Whether it’s adjusting bids, refining audience targeting, or tweaking creative elements, these suggestions can optimize your campaigns with minimal guesswork.
Competitor analysis is another valuable feature. Understanding how your campaigns stack up against industry benchmarks can highlight areas for improvement, saving you hours of manual research.
Customizable features like dashboards and alerts allow you to tailor the tool to fit your workflow. Personalized alerts ensure you never miss critical insights, while custom reports keep your team informed.
Finally, an intuitive interface is crucial. A tool that's easy to use shortens training time and encourages adoption. For example, Mixpanel’s user-friendly design has earned it a 4.6/5.0 rating for ease of use and detailed analytics.
With 88% of marketers reporting that AI has helped personalize the customer journey across channels, it’s clear that choosing the right tool isn’t just about convenience - it’s about driving measurable results and staying ahead in a competitive market.
1. Metabase
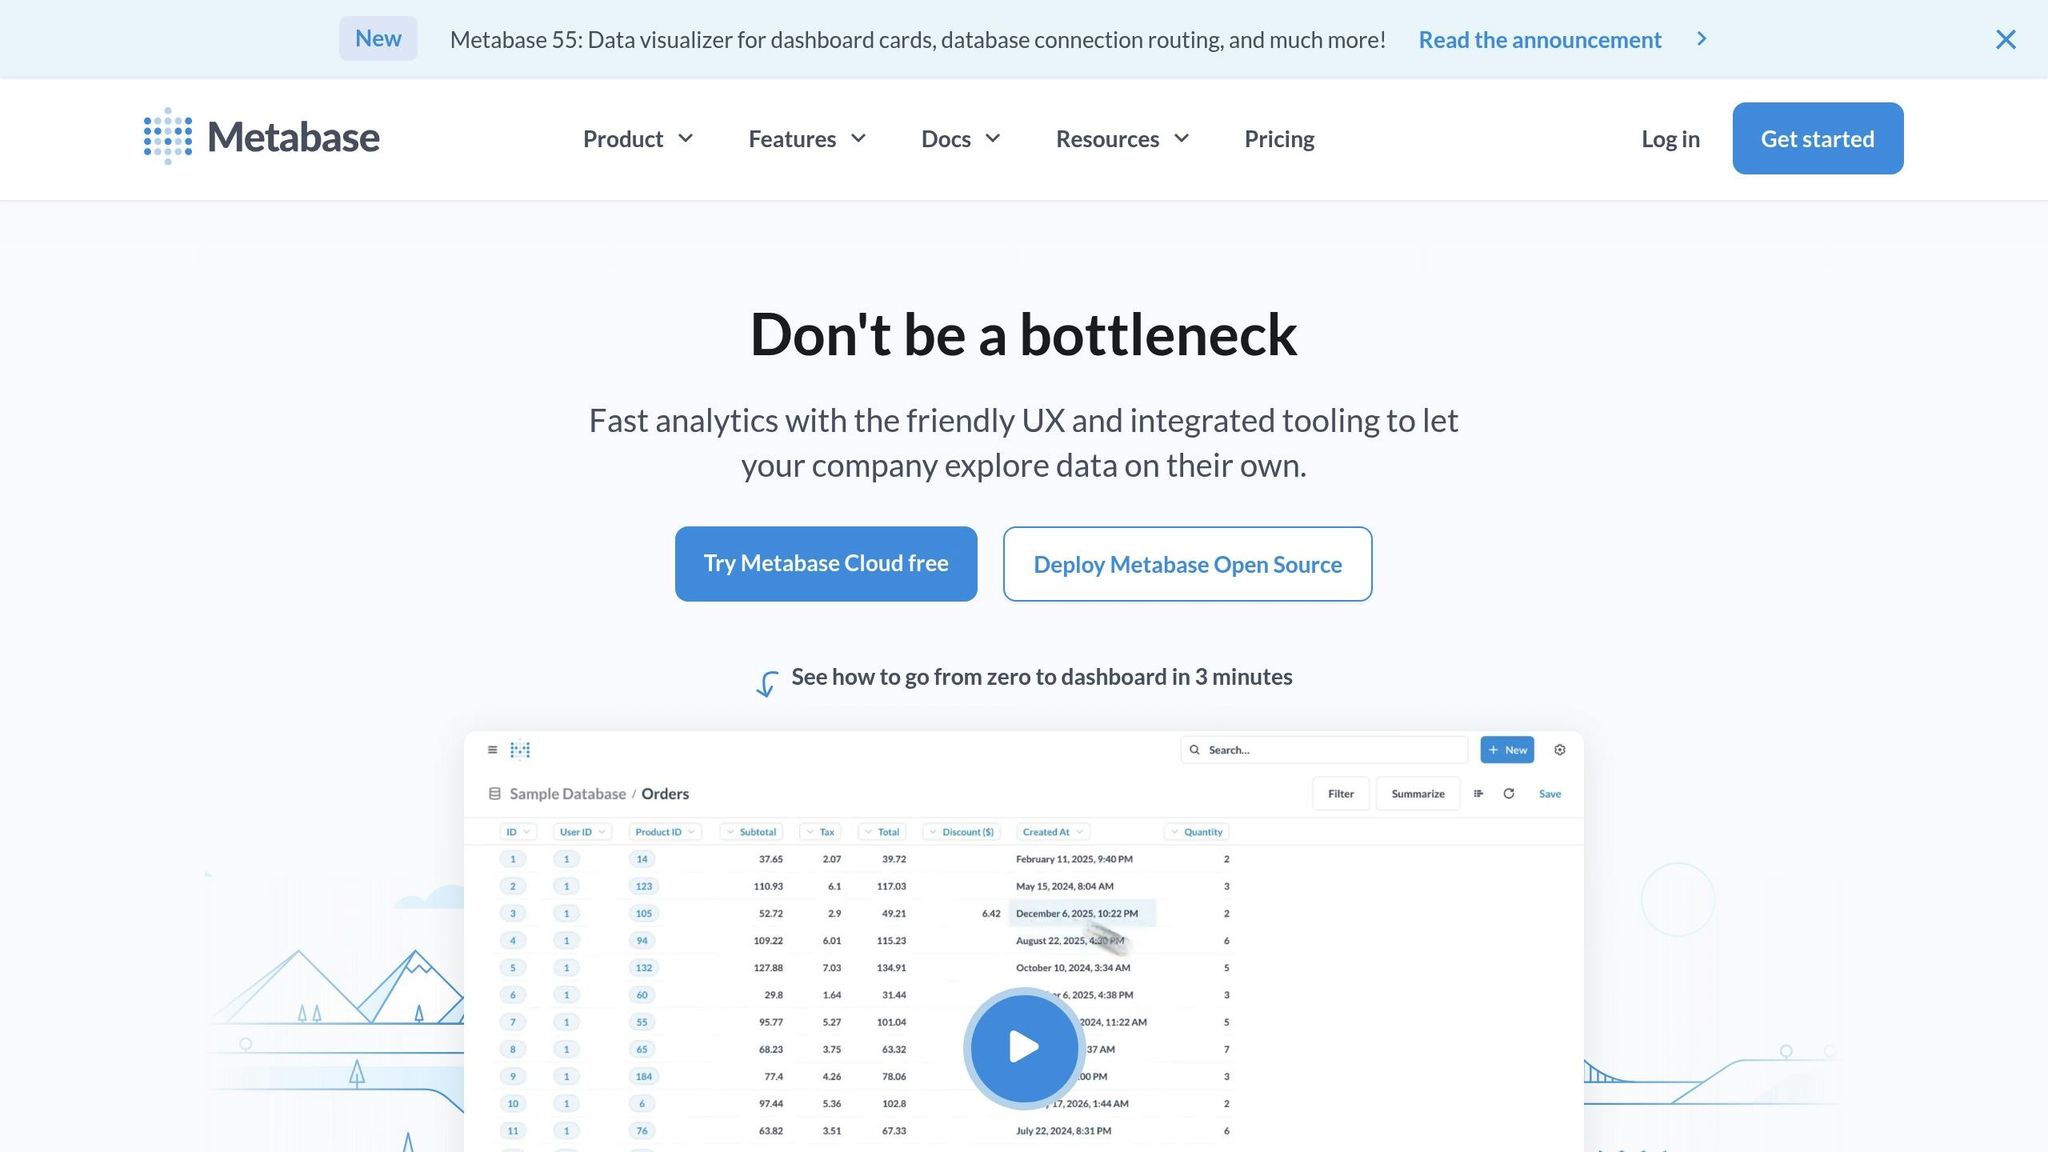
Metabase stands out as a powerful tool for turning raw data into meaningful insights. Designed with non-technical users in mind, it’s a go-to platform for marketers looking to track campaigns with ease. With over 70,000 companies relying on it, Metabase simplifies complex data into actionable takeaways through its straightforward interface.
What makes Metabase shine is how quickly it can be set up. TJ Muehleman, CEO at Standard Co, highlights this efficiency:
"One of the reasons we love Metabase is how quickly you can get up and running. We built our first dashboard in under 10 minutes and it was very simple and intuitive to use."
Real-time Analytics
Metabase brings all your key metrics into a single view with dashboards that refresh automatically at intervals you can set - whether it’s every 1, 5, 10, 15, 30, or 60 minutes. This makes it easy to monitor critical KPIs like conversions, revenue, pageviews, and system performance without needing to switch between platforms. Everything you need to evaluate campaign performance is right at your fingertips.
Automated Reporting
Dynamic reporting is another standout feature. Metabase uses text cards with variables that adapt headings and descriptions based on your filter selections. This means your reports adjust seamlessly as campaign parameters change, keeping them relevant and up to date.
Integration with Marketing Platforms
Metabase connects with over 20 data sources, including major marketing platforms like Google Analytics, Salesforce, and HubSpot. It syncs data in real time, ensuring that your metrics are always current as new information flows in. This integration saves time and provides a unified view of your campaigns.
Customizable Dashboards
Customization is where Metabase truly excels. You can set up custom click behaviors, allowing users to drill down from a high-level dashboard to detailed campaign analytics. For instance, clicking on a specific campaign in the overview can instantly filter the data to show only that campaign’s performance metrics.
The platform also offers dashboard filters, letting you adjust data views in real time. This makes it easy to segment information by date ranges, campaign types, or audience demographics, giving your team the flexibility to dive deeper into the data.
Dobo Radichkov, Chief Data Officer at Holland & Barrett, emphasizes how accessible the platform is:
"It's the first time in my years working in data that I saw non-technical business users create their own dashboards and analytics in our BI platform, all made possible because of Metabase's user friendly and intuitive data exploration and dashboarding capabilities."
For businesses looking to maintain a consistent brand identity, Metabase offers white-labeling options in its Pro and Enterprise plans. You can customize the color scheme, logos, and fonts to align with your company’s branding.
An eCommerce platform showcased the tool’s quick implementation by using Metabase's Embedded Analytics SDK to create a proof of concept for in-app reporting in less than 30 days - with just one developer. This level of efficiency sets a high standard as we move on to the next tool.
2. Power BI
Microsoft's Power BI is a game-changer for marketers seeking to make sense of complex data and transform it into meaningful insights. This business intelligence platform simplifies data analysis, helping organizations make smarter decisions. Christopher Van Mossevelde, Head of Content at Funnel, sums it up perfectly:
"Power BI offers marketers centralized data, powerful visualizations and real-time insights that make tracking and optimizing campaigns easier."
Real-time Analytics
One of Power BI's standout features is its ability to deliver real-time analytics by processing live data as it's updated. Tools like streaming datasets, DirectQuery, and push datasets make this possible. This means marketers can track campaign performance as it happens - a crucial advantage when 56% of executives cite data quality as a major obstacle to effective decision-making. The results speak for themselves: a credit union increased credit card adoption among young professionals by 31% through targeted campaigns, while a regional fashion brand reactivated dormant customers, achieving a 23% boost in conversions.
Integration with Marketing Platforms
Power BI seamlessly connects with both cloud-based and on-premises data sources, creating a centralized hub for analysis. Whether it's Azure, Excel, Salesforce, Microsoft Dynamics, Google Analytics, or other platforms, Power BI brings everything together. Its Apps feature takes this integration further by consolidating dashboards and reports into a single interface. For example, it can combine data from Google Ads with sales records, enabling teams to collaborate more effectively. This streamlined data management has been shown to drive revenue growth, often contributing to financial gains of 20% to 40%.
Customizable Dashboards
Power BI's dashboards are incredibly versatile, allowing users to create interactive, tailored displays. From bar charts and line graphs to maps and pie charts, the tool offers a wide range of visualizations. Additional visuals can even be downloaded from MS AppSource for more detailed reporting. For example, a Marketing Campaign dashboard might showcase key metrics like ROI and conversion rates using bar charts, pie charts, and heatmaps to visualize geographic performance. Interactive features like filtering by channel, campaign, or date range, along with drill-down options, make it easy to focus on the details without feeling overwhelmed.
As Van Mossevelde puts it:
"Power BI brings your marketing data to life, transforming insights into action."
Next, we’ll dive into another tool that’s shaping the way marketers track campaign performance.
3. Tableau
Tableau is a standout tool for marketers looking to simplify complex campaign data into clear, actionable visuals. It takes the overwhelming nature of spreadsheets and databases and transforms them into compelling stories that guide smarter marketing decisions. As Andrew Richardson, Vice President of Analytics and Marketing Science at Tinuiti, puts it:
"If we didn't have Tableau, we would be behind where we are today and need more staff to do the same amount of work. These consumable, dynamic dashboards are making a really big difference for us and our customers."
Real-time Analytics
One of Tableau's most impressive features is its real-time analytics, which allow marketers to track campaign performance as it happens. With the Tableau Pulse feature, insights are delivered directly into workflows, making it easier to take immediate action. For example, in Q2 2025, a Chief Marketing Officer at a tech firm used Tableau Pulse to monitor campaigns in real time, enabling quick budget adjustments and optimized spending. Similarly, a multinational software company integrated Tableau Pulse into their sales operations. Sales teams received Pulse updates ahead of weekly pipeline reviews, and a dedicated Slack channel (#pulse-alerts) flagged critical changes. One such alert identified a significant drop in win rates, which was traced to a specific product line, allowing the team to resolve the issue swiftly. These instant insights seamlessly connect with Tableau's automated reporting features.
Automated Reporting
Tableau simplifies reporting by automating data updates and delivering insights precisely when needed. For instance, Shopitize, a mobile app company, reduced its reporting time from days to mere minutes after adopting Tableau for real-time retail intelligence.
Integration with Marketing Platforms
Another strength of Tableau is its ability to integrate with nearly any marketing platform, offering a unified view of campaign performance. It connects natively with tools like Salesforce, Google Analytics, Facebook Ads, Google Ads, and HubSpot, often through integrations such as Funnel.io. Andrew Richardson highlights this capability:
"As marketers, we have so much data we need to act upon and Tableau gives us the ability to connect to many different data sources in the marketing ecosystem."
Tableau also works seamlessly with cloud storage solutions like Amazon S3, Google Cloud Storage, and Microsoft Azure Blob Storage, as well as data warehousing platforms such as Amazon Redshift, Google BigQuery, and Microsoft Azure SQL Data Warehouse.
Customizable Dashboards
Building on its integration capabilities, Tableau offers highly customizable dashboards that let marketers tailor their views to specific campaign metrics. Users can create calculated fields for unique metrics, design displays for key performance indicators, and organize summaries by channel or source. Cherry Bekaert, for example, helped a global healthcare company transition from Excel spreadsheets to Tableau Pulse, establishing a centralized system for real-time data visualization. This shift improved data quality, reduced operational issues, and enhanced employee productivity. Stephen McClelland, Digital Strategist at ProfileTree, sums up Tableau's potential:
"In Tableau, marketers can harness the full power of their data to streamline their workflows and magnify the impact of their campaigns across global markets."
Additionally, Tableau provides tools to track ROI and customer acquisition costs, giving marketers a clear view of financial performance. This includes the ability to evaluate individual channel performance using detailed analytics.
4. Google BigQuery
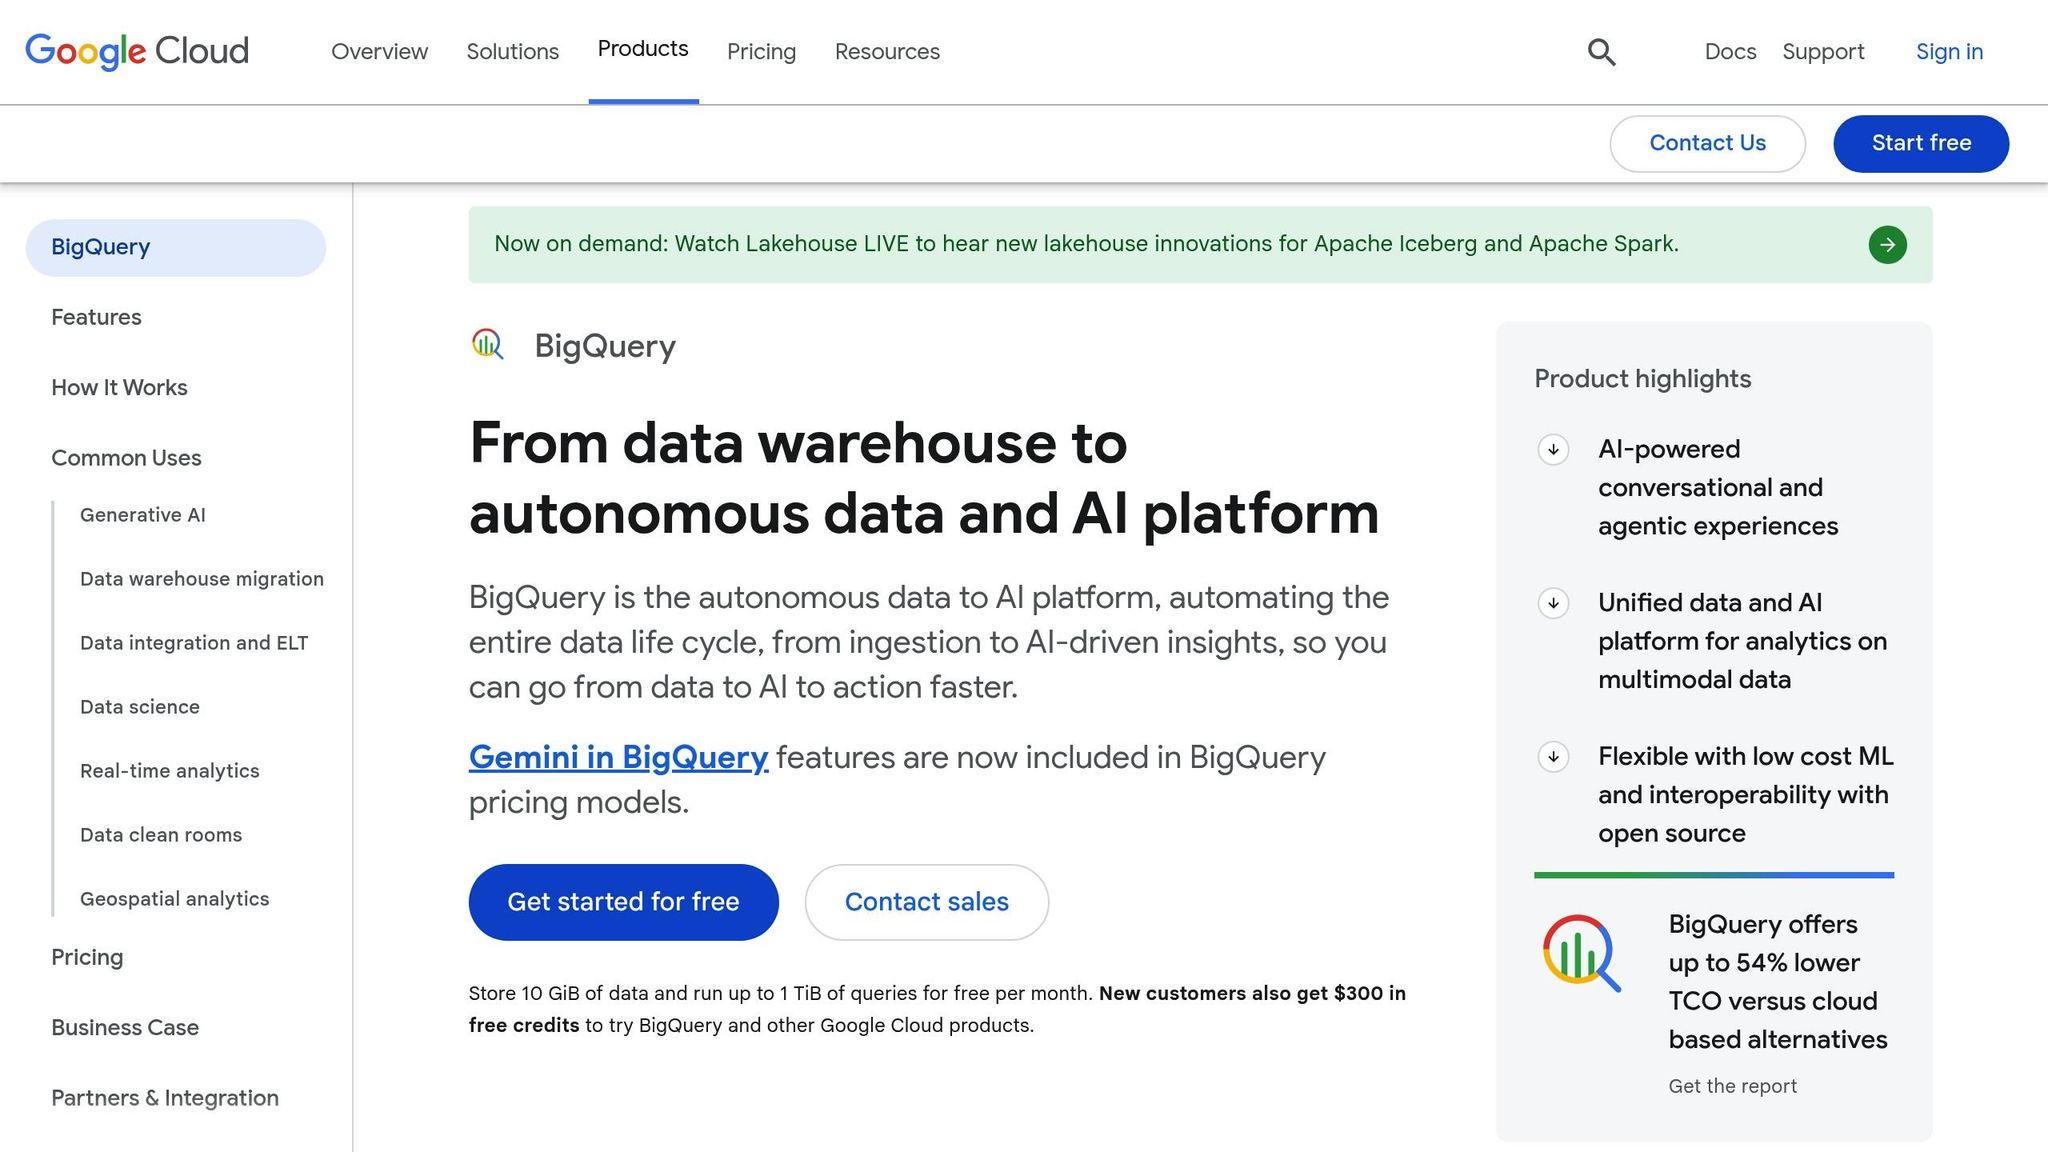
Google BigQuery is a powerful tool for handling massive campaign datasets with speed and efficiency. Unlike traditional analytics platforms that can stumble when faced with large volumes of data, BigQuery processes SQL queries on terabytes of information in just seconds. This makes it a standout option for businesses managing enterprise-level campaign tracking.
Real-time Analytics
BigQuery's real-time capabilities are a game-changer for campaign optimization. Its built-in streaming features allow data to be ingested and queried immediately, eliminating the need to wait for periodic reports. This enables marketers to act on trends, address issues, and seize opportunities as they unfold.
For instance, Auto Trader UK relies on BigQuery to manage real-time inventory and pricing data for over 430,000 cars listed daily and 63 million cross-platform visits every month. This highlights how BigQuery handles high-volume, time-sensitive data seamlessly. Similarly, Shopify has tapped into BigQuery's real-time machine learning to refine consumer search intent, directly boosting their campaign targeting. These examples underscore how BigQuery empowers marketers to work with live data effectively.
Integration with Marketing Platforms
BigQuery excels at integrating data from various sources, creating a unified environment for analysis. It consolidates information from Google's advertising ecosystem - like Search, Display, and YouTube campaigns - and third-party tools like Supermetrics, making performance data easily accessible .
For those using customer data platforms (CDPs), BigQuery becomes even more versatile. Tools like Syntasa enable data ingestion from multiple sources, including web analytics, CRMs, e-commerce systems, and offline transaction databases. This integration provides a comprehensive view of campaign performance, customer behavior, and sales metrics.
Customizable Dashboards
BigQuery's integration with Cloud Monitoring and Looker Studio enhances its dashboard capabilities. In Cloud Monitoring, users can create custom dashboards to track metrics such as query execution times, data processing volumes, and resource usage. For more campaign-centric visualizations, Looker Studio offers tailored dashboards and reports, making it easier to present data in meaningful ways .
Additionally, third-party tools like Whatagraph provide drag-and-drop functionality for creating custom dashboards. This flexibility ensures that campaign data can be presented in formats suitable for various stakeholders, from high-level executive summaries to in-depth performance details.
TJ Allard, Lead Data Scientist at Mattel, highlights BigQuery's impact on streamlining data-driven marketing:
"BigQuery and Vertex AI bring all our data and AI together into a single platform. This has transformed how we take action on customer feedback from a lengthy manual process, to a simple natural language query in seconds, allowing us to get to customer insights in minutes instead of months."
sbb-itb-ad96eed
5. Looker Studio
When it comes to simplifying campaign data tracking, Looker Studio stands out as a powerful, free tool tailored for marketers. This data visualization platform from Google transforms raw campaign data into actionable insights. With built-in connections to nearly 1,000 data sources, it eliminates the hassle of juggling multiple tools and delivers professional-grade reports - all at no cost.
Real-time Analytics
One of Looker Studio's standout features is its real-time analytics. By linking directly to Google Analytics 4 (GA4), it generates live dashboards that automatically update as new data comes in. You can even customize how often the data refreshes, ensuring that metrics like active users, event counts, page titles, and traffic sources are always up to date. For advanced users, the GA4 Realtime Reporting API offers even greater flexibility for pulling data.
Integration with Marketing Platforms
Looker Studio shines in its ability to bring together data from various marketing platforms into one cohesive view. For example, InPulse, a digital marketing agency, used Looker Studio alongside integration tools like Supermetrics to automate reporting for paid media campaigns. This setup allowed clients to view campaign performance in real-time while freeing up the team to focus on strategy instead of manual reporting.
Marketers can effortlessly pull data from platforms like Google Ads, Google Analytics, Facebook, and Twitter to create unified reports. This consolidated approach not only eliminates data silos but also provides a clear, comprehensive view of ad performance and user behavior across platforms.
Customizable Dashboards
Customization is a key strength of Looker Studio. Marketers can design dashboards that reflect their brand by adding logos, dynamic filters, and custom metrics tailored to specific KPIs. For instance, they can combine data on traffic sources, campaign names, and conversions into visual charts or use scorecards and tables for detailed eCommerce reporting .
The secret to effective dashboards lies in thoughtful organization. Start by placing the most important metrics at the top for immediate visibility. Use color sparingly but strategically to draw attention to significant changes or anomalies. Grouping related metrics together also enhances clarity, making it easier for stakeholders to grasp campaign performance without confusion.
With its focus on real-time updates, seamless integrations, and customizable reporting, Looker Studio provides marketers with a comprehensive tool for understanding and optimizing their campaigns. This sets the stage for tool comparisons in the next section.
6. Mode
Mode offers a powerful platform designed for marketing teams that need advanced analytics combined with easy-to-use reporting tools. It bridges the gap between technical analysts and business users, going beyond standard dashboards to include features like machine learning integrations with Python and R - making it an excellent choice for tracking marketing campaigns effectively.
Automated Reporting
With Mode, reporting becomes a smoother, less time-consuming process. The platform’s ad-hoc reporting system allows teams to craft custom visualizations and schedule them for automatic delivery. This ensures everyone stays informed with up-to-date campaign metrics. Additionally, users can set up recurring queries and webhooks to receive real-time alerts when critical metrics meet predefined thresholds. This functionality is especially useful for simplifying weekly performance reviews and monthly ROI assessments.
"Mode is incredibly valuable as a full stack, full-service platform from a data analyst all the way to an end user. Analysts can go deep, end users get the data they need, and our team gets to make everyone a part of the data strategy." – Adam Smith, Analytics Manager
Integration with Marketing Platforms
Mode connects effortlessly with over 500 data sources, making it a go-to solution for centralizing data visualization while still using preferred marketing tools. It integrates with major advertising platforms like Google Ads, Facebook, DV360, and Trade Desk. When paired with services like Improvado, it can automatically funnel marketing data into live dashboards and reports. The platform also syncs with major data warehouses and supports a wide range of tech stack integrations, providing a comprehensive view of performance.
Customizable Dashboards
Mode’s dashboards are not only interactive but also highly customizable, allowing users to dive deep into campaign data with adjustable parameters and filters. For more advanced customization, the platform supports HTML, CSS, and JavaScript, ensuring that dashboards can adapt to a company’s evolving marketing needs. Pricing for enterprise plans ranges from $6,000 to $50,000 annually, while smaller teams can take advantage of the free Studio plan, which supports up to three users. This makes it a flexible option for teams looking to test its full potential before committing to a larger investment.
7. Rows
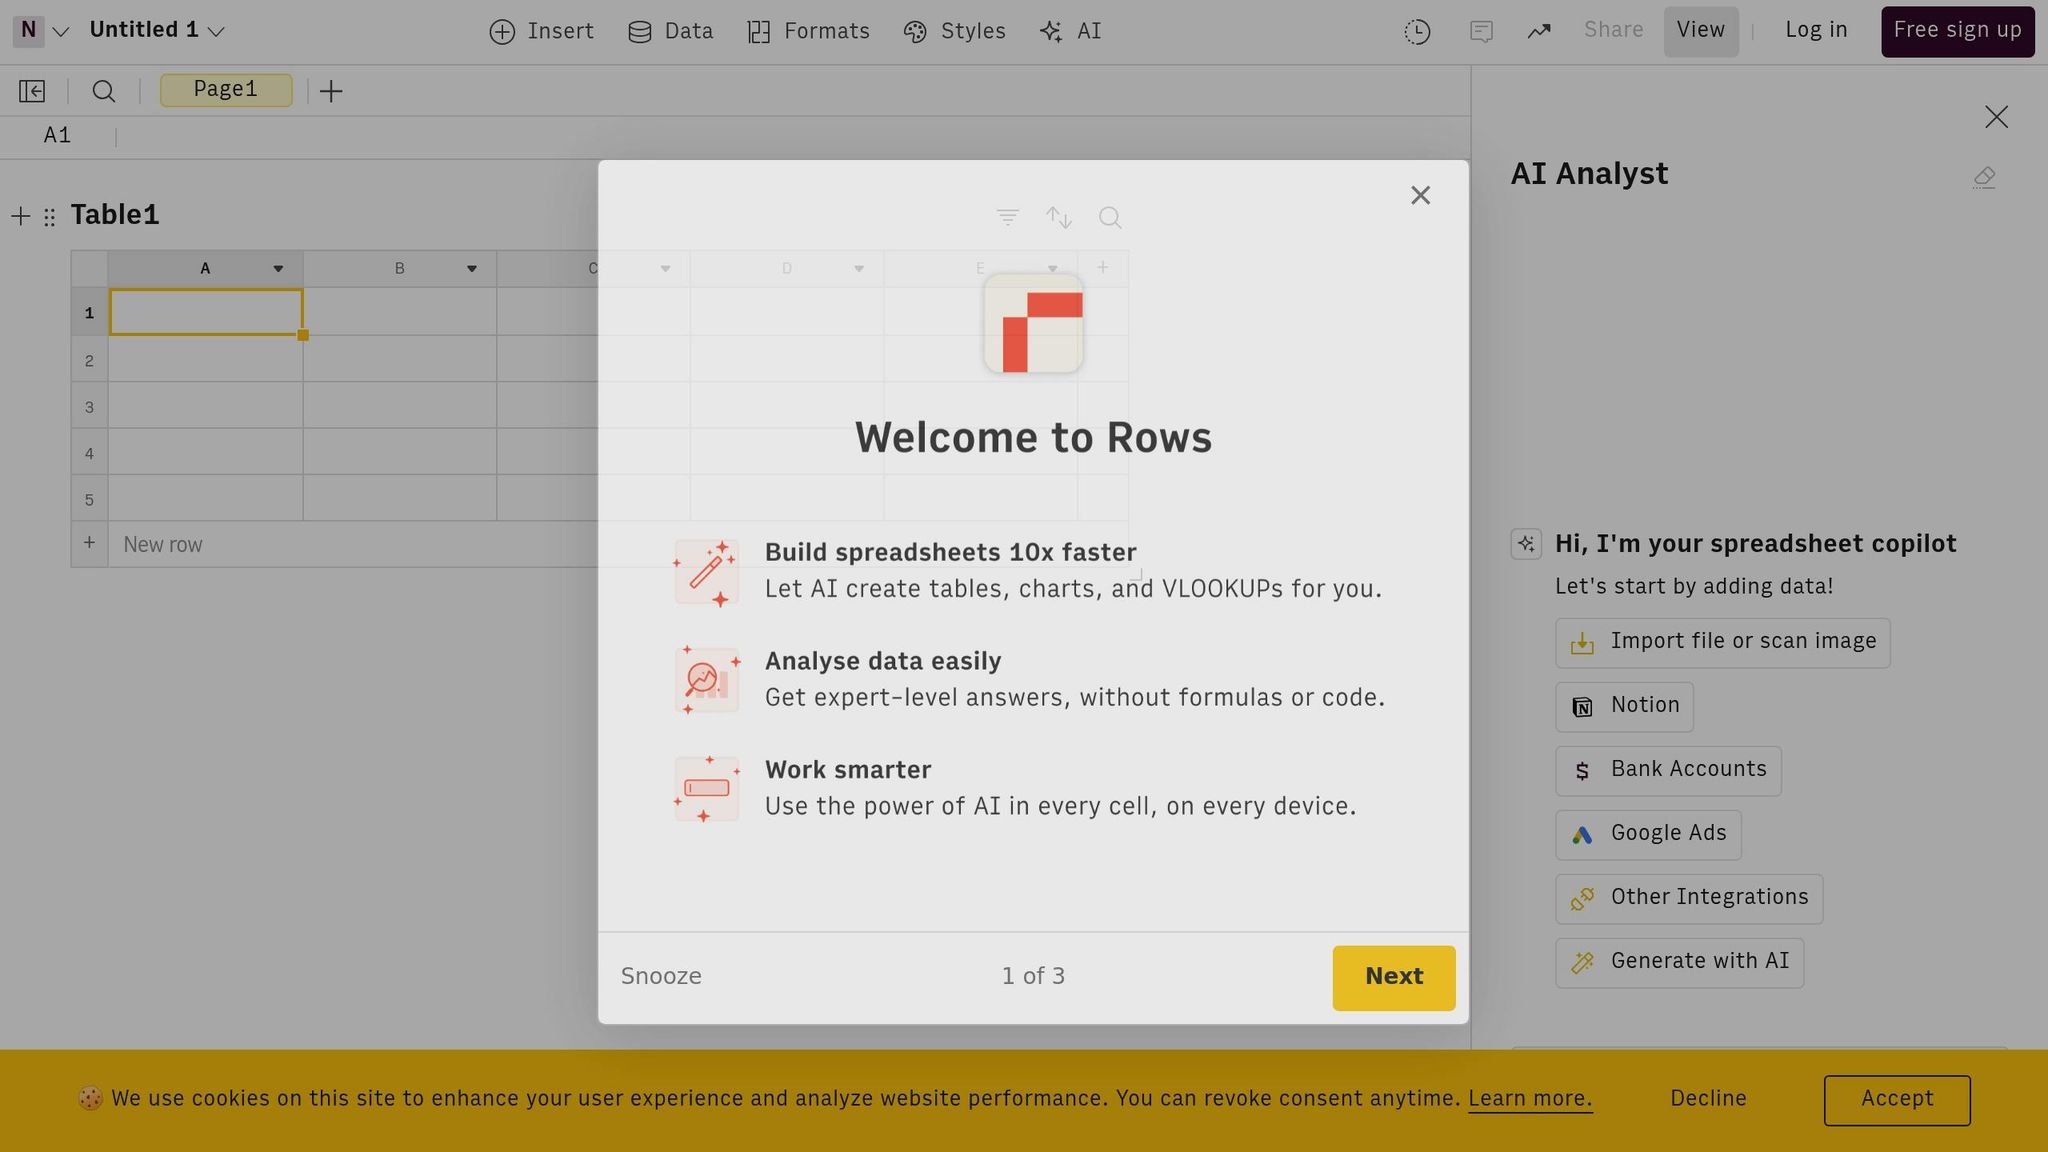
Rows is a spreadsheet-based analytics tool that combines the familiarity of traditional spreadsheets with the power of AI and extensive marketing integrations. Unlike standard spreadsheet software, Rows comes equipped with built-in AI capabilities and real-time data connections, making it a standout option for marketers and data analysts alike.
Real-time Analytics
With Rows, you can access real-time data updates from connected marketing platforms. This means you can track ad campaigns, monitor website performance, and analyze search queries or keyword insights - all in real time. The platform even provides live data feeds for page speed metrics, helping you fine-tune both your website and ad campaigns [78,80].
"I've been using Rows to track my daily Twitter following growth so I can see both daily and week-over-week growth."
– Adam J. Ceresko, Senior Product Manager, Scribd
These live updates pave the way for streamlined, automated reporting to simplify workflows.
Automated Reporting
Rows takes the hassle out of manual data collection and reporting with its automated reporting system. You can set up reports to refresh automatically and configure Slack or email alerts to notify you of key trends or performance thresholds. This ensures your team can react quickly when campaigns reach specific milestones or need adjustments.
Integration with Marketing Platforms
Rows connects seamlessly with over 40 major marketing platforms, including Google Analytics, Twitter, Instagram, YouTube, LinkedIn Ads, and Facebook Ads. Thanks to partnerships with Integrately (offering 1,200+ app connections) and Zapier (thousands of apps), the platform creates a highly connected ecosystem [81,82]. As Humberto Ayres Pereira, co-founder of Rows, puts it:
"In marketing, we see users gather organic and paid sources and build custom dashboards. You can mix and match data from YouTube, Google, Facebook, LinkedIn, Twitter, or any kind of ad."
These integrations allow users to pull data directly from their marketing tools into Rows without needing tedious manual exports or complex pipelines. This makes creating tailored, interactive dashboards a breeze.
Customizable Dashboards
Rows transforms spreadsheets into interactive dashboards, complete with charts, buttons, and input fields for campaign tracking. Users can select from a range of performance metrics - like traffic sources, conversion rates, and engagement levels - to create dashboards that meet their specific needs. Nathalie Belchior Massa, Marketing & BD Manager at Spryng, shares:
"With Rows, I easily created a list with a real-time overview of all the social media data of the Spryng pages."
Dynamic visualizations turn raw data into actionable insights. You can modify existing templates by tweaking data sources, adding new rows or columns, and building custom tables, pages, or charts. For those who prefer a head start, Rows provides pre-made templates for common marketing tasks, such as Instagram analytics, Facebook Ads reports, SEO tracking, and Google Ads performance reviews.
The platform offers a free plan that includes unlimited spreadsheets, unlimited team members, and up to 50 integration executions per month. This makes it a great option for teams looking to explore its features before committing to a larger plan.
Tool Comparison Table
Here's a quick-reference guide summarizing the key features of various tools for tracking campaign performance. This table condenses earlier discussions into an easy-to-digest format for decision-makers.
| Tool | AI Features | Data Connections | User-Friendliness | Pricing (USD) | Best Use Cases |
|---|---|---|---|---|---|
| Metabase | Natural language queries, automated insights, predictive analytics | 20+ databases including PostgreSQL, MySQL, MongoDB | High – intuitive interface with drag-and-drop functionality | Free (open source), Cloud starts at $85/month | Small to medium businesses, teams wanting self-service analytics |
| Power BI | AI-powered Q&A, automated machine learning, anomaly detection | 100+ data sources including Microsoft ecosystem, web APIs | Medium – requires some learning curve but extensive documentation | $10/user/month (Pro), $20/user/month (Premium) | Enterprise environments, Microsoft-centric organizations |
| Tableau | Ask Data feature, Einstein Discovery, automated forecasting | 70+ native connectors, extensive third-party integrations | Medium – powerful but complex interface | $70/user/month (Creator), $42/user/month (Explorer) | Large enterprises, advanced data visualization needs |
| Google BigQuery | Built-in ML models, AutoML integration, intelligent query optimization | Native Google Cloud integration, APIs for external data | Low – requires SQL knowledge and technical expertise | Pay-as-you-go: $5 per TB processed, $0.02 per GB stored/month | Data engineers, large-scale data processing, technical teams |
| Looker Studio | Smart suggestions, automated chart recommendations, data insights | 800+ partner connectors including Google Marketing Platform | High – user-friendly drag-and-drop interface | Free for basic use, enterprise pricing varies | Small businesses, Google ecosystem users, quick reporting |
| Mode | Automated anomaly detection, predictive modeling, smart alerts | 40+ data sources, SQL and Python support | Medium – combines ease of use with advanced capabilities | $35/editor/month (Starter), custom enterprise pricing | Data teams, collaborative analytics, mixed skill levels |
| Rows | Real-time data processing, automated reporting, intelligent alerts | 40+ marketing platforms plus 1,200+ apps via integrations | High – familiar spreadsheet interface with advanced features | Free plan available, paid plans start at $59/month | Marketers, small teams, spreadsheet-comfortable users |
Key Insights
- Ease of Use Matters: Tools with intuitive interfaces, like Metabase and Looker Studio, are ideal for teams seeking quick adoption with minimal training.
- Integration Focus: Each tool has its ecosystem strengths. For example, Power BI excels in Microsoft environments, while Looker Studio is perfect for Google users.
- AI Features: Effective tools blend AI with data analysis, enabling predictive insights without requiring complex syntax.
When evaluating pricing, think beyond the sticker cost. Free options like Metabase and Rows are great for smaller teams to test features before committing to a paid plan. And don’t forget to factor in scalability - especially if your data needs are likely to grow!
Conclusion
From the detailed tool breakdown above, one thing is crystal clear: AI is reshaping marketing in ways that are impossible to ignore. U.S. marketers who integrate these tools into their strategies are already reaping impressive benefits. The seven AI-powered campaign tracking tools we've discussed are just scratching the surface of what’s achievable when artificial intelligence meets smart marketing strategies.
Take Booking.com, for example, which achieved a 73% boost in conversion rates using predictive audience modeling. This is just one of many cases that highlight the advantages we’ve explored.
"The future of paid advertising lies not in reaching more people, but in reaching exactly the right people with exactly the right message at exactly the right time. AI makes this level of precision possible." – Eric Siu, CEO of Single Grain
The numbers tell a compelling story: 83% of sales teams using AI saw revenue growth, compared to 66% for those that didn’t in 2024. Companies automating processes with AI report productivity increases of up to 40%, while those using AI for customer interactions enjoy 10-15% higher customer retention rates. With the AI marketing industry projected to leap from $15.84 billion in 2021 to over $107.5 billion by 2028, adopting these tools isn’t just a good idea - it’s becoming a necessity to stay competitive.
From Metabase to Rows, each tool offers a unique way to turn campaign data into actionable insights. Whether you’re a small business exploring free options like Looker Studio or a large enterprise leveraging robust platforms like Tableau, the key is to dive in and start experimenting.
If you’re looking for even more tools tailored to campaign analysis, advertising, content creation, or social media marketing, AI Marketing List is a fantastic resource. This platform organizes AI tools by category, helping you find exactly what you need to supercharge your marketing efforts. As the pace of innovation accelerates, having a go-to resource like this becomes an invaluable asset.
AI is already revolutionizing the marketing world. The question is: will you embrace its potential or risk being left behind?
FAQs
How can I choose the best AI tool to track my marketing campaign performance?
To choose the right AI tool for tracking your marketing campaign performance, start by pinpointing your specific goals. Are you looking to analyze campaign data, access real-time insights, or streamline reporting? Defining these objectives will help narrow down your options.
Next, evaluate key aspects like how seamlessly the tool integrates with your current systems, whether it’s user-friendly, and the level of customization it provides. Tools that offer predictive analytics and actionable insights tailored to your goals can be especially useful.
Make sure the tool fits within your budget while delivering measurable returns on your investment. It's also wise to prioritize solutions that ensure strong data security and are scalable enough to grow alongside your business needs.
What are the main advantages of using AI tools for tracking campaign performance in real time?
Benefits of Using AI Tools for Real-Time Campaign Tracking
AI tools bring a host of benefits to real-time campaign performance tracking. They deliver instant access to key metrics, helping marketers make quick adjustments to strategies and improve their ROI. With these tools, you can gain deeper insights into customer behavior and attribution, which means more precise targeting and smarter use of resources.
Another major perk? They cut down on manual work by automating data collection and analysis. This makes decision-making faster and more data-driven. Not only does this save valuable time, but it also increases the chances of marketing campaigns hitting their goals by keeping strategies fine-tuned on the fly.
Do these AI tools work with the marketing platforms I already use?
Yes, many AI marketing tools are built to work effortlessly with popular platforms in the U.S., like Google Ads, Facebook, Instagram, and LinkedIn. This integration makes it easier to automate tasks, tailor campaigns to your audience, and dig deeper into your marketing performance data.
Since these tools are designed with compatibility in mind, they fit smoothly into your current marketing setup without causing disruptions. This means you can improve your campaigns and streamline processes without having to rebuild everything from the ground up.